

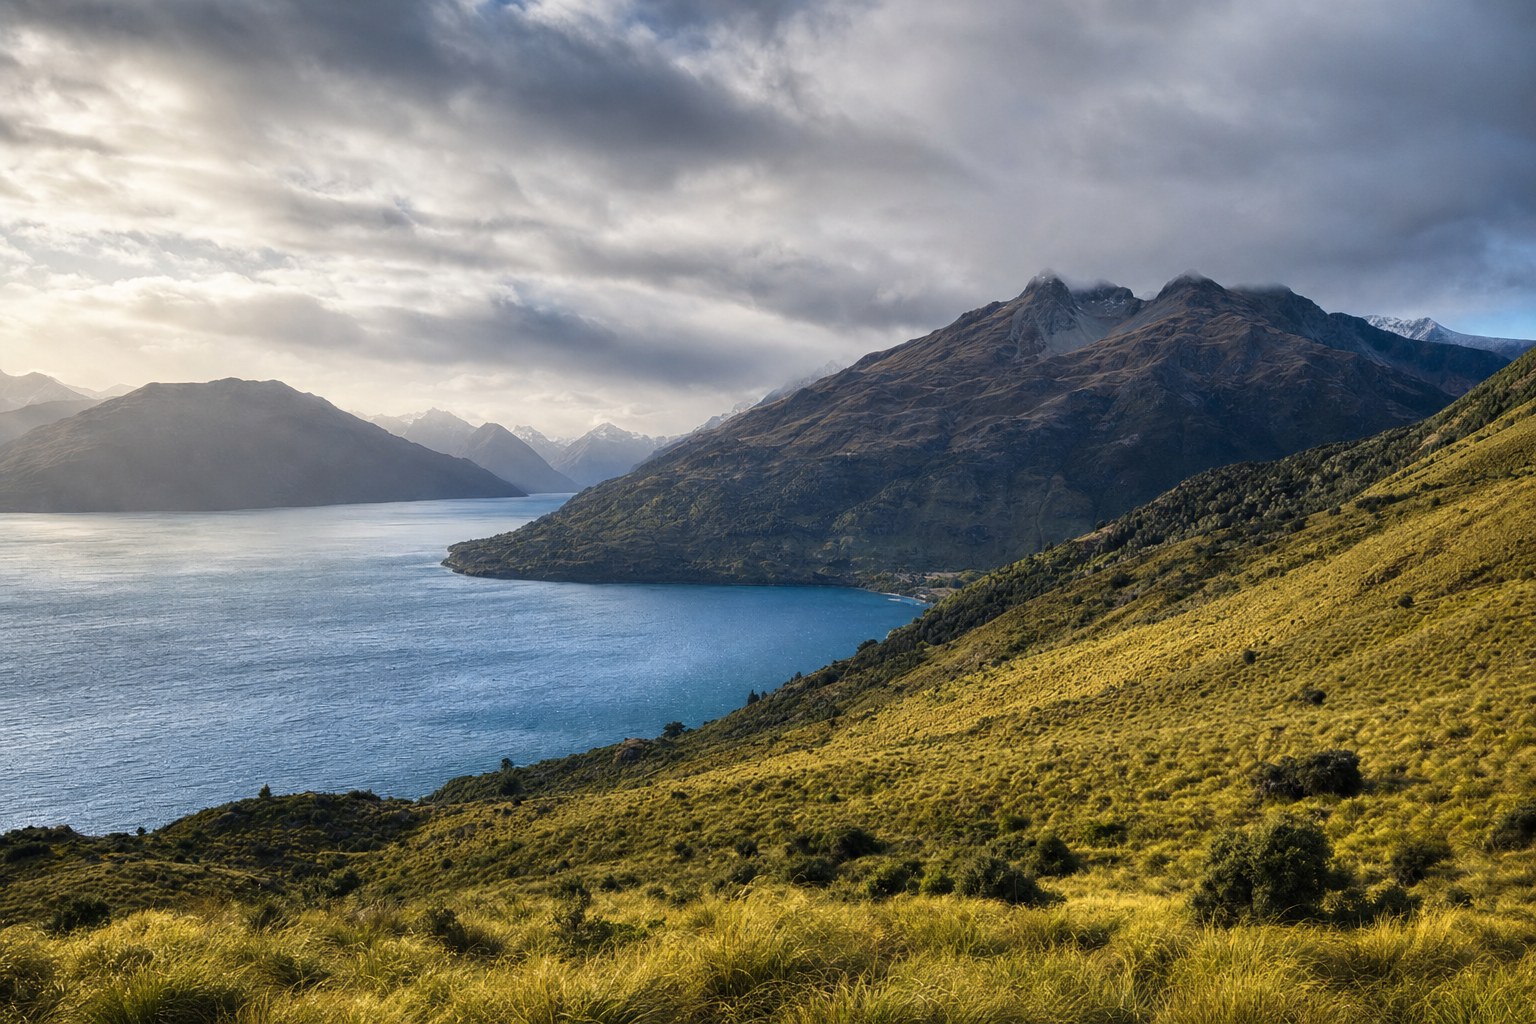
New Zealand’s north, south, east and west differ because latitude, elevation, mountain barriers and exposure to prevailing westerly winds combine in different ways. The result is not one national pattern but several regional climate patterns, from warm subtropical conditions in the far north to cool temperate conditions in the far south and alpine conditions at high elevations.
Key takeaways for New Zealand readers
- Conditions range from warm subtropical in the far north to cool temperate in the far south, with alpine conditions at high elevations.
- Mountain chains obstruct prevailing westerly winds, creating marked differences between western and eastern regions.
- The South Island’s West Coast is especially wet, while areas east of the mountains are much drier despite being relatively close.
- Northern and central areas generally receive more rain in winter than summer, but winter is the least rainy season in much of the south.
- Seasonal temperature variation is generally greater inland and east of the ranges than in locations with stronger ocean influence.
- Historical averages describe broad patterns for stated reference periods. They are not current observations or forecasts.
One country, several regional climate patterns
A single label such as “New Zealand climate” is useful only as a starting point. The country contains several broad climate groups, and neither the North Island nor the South Island can be accurately described as having one uniform climate.
The Earth Sciences New Zealand and NIWA climate overview distinguishes multiple regional groups. Its broad national picture includes north–south differences, west–east contrasts and the effects of elevation. These patterns overlap, so broad island or compass-point labels should not be read as precise descriptions of every location within them.
For example, “northern” can refer to the general tendency towards warmer conditions, but it does not erase differences associated with terrain or exposure. Likewise, “southern” indicates a broad move towards cooler temperate conditions, yet high elevations form a separate alpine setting. Regional language is therefore most useful when it identifies a tendency rather than implying identical conditions across a large area.
The same caution applies to east and west. Those labels become especially meaningful where mountain chains interact with prevailing westerly winds, but they do not make every western location equivalent or every eastern location alike. The national overview is a framework for reading contrasts, not a substitute for location-specific observations.
From the far north to the far south
The broadest north–south contrast runs from warm subtropical conditions in the far north to cool temperate conditions in the far south. This is a national-scale pattern rather than a sharp boundary between two climate zones. Conditions change across distance, while local elevation and regional geography add further variation.
High-elevation areas are an important qualification. The national overview identifies alpine conditions at high elevations, showing why latitude alone cannot explain the full climate picture. A place’s north–south position may indicate one broad tendency, while elevation places it in a distinctly different setting from nearby lower land.
This is also why comparisons between the two main islands need care. It is reasonable to discuss a broad shift from warmer conditions in the north to cooler conditions in the south, but it is not reasonable to assume that all of the North Island shares one pattern or all of the South Island shares another. The source itself separates the country into multiple regional climate groups rather than relying on a two-island division.
North and south are therefore best understood as one layer of the climate geography. Mountain barriers, elevation, western or eastern position, and the degree of ocean influence add other layers. A useful regional description keeps these factors together instead of asking one compass direction to explain everything.
Mountain ranges and prevailing westerlies
Mountain chains are central to New Zealand’s west–east climate contrast. According to the official national climate overview, they obstruct the prevailing westerly winds and produce marked differences between regions on opposite sides of the ranges.
This helps explain why two areas can be relatively close on a map yet have notably different rainfall patterns. Geographic distance by itself does not indicate climatic similarity. If a major mountain barrier lies between two locations, their positions relative to the prevailing westerlies can be more informative than a simple straight-line comparison.
The relationship should still be described at the appropriate scale. “West” and “east” are broad geographic categories, and the overview does not imply that every point on either side receives the same conditions. Its key message is that the ranges create a marked regional contrast. It does not turn each side into a single uniform zone.
Elevation also matters independently within this mountain setting. The presence of alpine conditions at high elevations means that a mountain chain is not merely a dividing line between wetter and drier regions. It is also a climate environment in its own right. Regional comparisons are clearest when the high country is not folded into the same description as adjacent lower areas.
The South Island’s west–east contrast
The South Island provides the clearest example in the national overview. Its West Coast is especially wet, while areas east of the mountains are much drier despite their relative proximity. This contrast reflects the interaction between the mountain barrier and prevailing westerly winds.
Relative proximity is a significant part of the comparison. It shows why nearby places do not necessarily have similar rainfall settings. The mountains separate the western and eastern sides in climatic terms even where the physical distance between them may appear modest at a national scale.
However, this comparison has limits. “Especially wet” characterises the West Coast broadly, while “much drier” describes the areas east of the mountains in relation to it. Neither phrase supplies a current rainfall observation, and neither should be applied as an exact statement about every location or every period.
The comparison also should not be expanded into a claim that the whole western South Island shares one climate or that the entire eastern side shares another. The official overview distinguishes multiple regional groups. The west–east divide is a major organising feature, but it sits within a more varied regional picture.
In New Zealand climate geography, being nearby does not necessarily mean being climatically alike. A mountain barrier can create a strong regional contrast across a relatively short separation.
Coastal and inland temperature differences
Ocean influence adds another dimension to the regional picture. The seasonal temperature range is generally greater inland and east of the ranges than in more ocean-influenced locations, according to the Earth Sciences New Zealand and NIWA overview.
A seasonal temperature range describes the difference across the seasons rather than identifying a location as simply warm or cool. This distinction matters. A place can belong to a broader cool or warm region while also having a relatively large or small seasonal range. Those are related but different ways of describing climate.
“Inland” and “coastal” should also be handled as relative terms. The source supports a general comparison between inland or eastern settings and locations with stronger ocean influence. It does not establish that all coastal places have identical seasonal variation, nor that all inland places behave alike.
The ranges connect this temperature pattern to the wider west–east geography. Areas east of the ranges are identified as generally having greater seasonal temperature variation than more ocean-influenced locations. Yet the word “generally” remains important: it signals a regional tendency, not a rule that resolves every local comparison.
Why rainfall seasons differ across the country
Rainfall does not follow the same seasonal pattern everywhere. Northern and central areas generally receive more rain in winter than in summer. In much of the south, by contrast, winter is the least rainy season.
This distinction demonstrates why a national statement about a “wettest” or “driest” season would be misleading. A seasonal description that broadly fits northern and central areas does not automatically carry into much of the south. The contrast is geographic as well as seasonal.
The wording of the source defines the appropriate limits. “Generally” leaves room for variation within northern and central areas, while “much of the south” does not mean every southern location. These qualifiers are not minor details; they keep broad climate patterns from being mistaken for universal local rules.
Rainfall amount and rainfall seasonality should not be confused. The West Coast’s especially wet character and the east’s much drier setting describe a strong geographic contrast in rainfall. The winter-versus-summer statements describe when rain is generally more or less prominent in broad parts of the country. One comparison concerns regional wetness, while the other concerns seasonal distribution.
Keeping those ideas separate makes regional climate information easier to read. A broad area’s seasonal rainfall pattern does not, by itself, state how much rain a particular location receives. Equally, describing one region as wetter than another does not identify its rainiest season.
What historical climate averages can and cannot tell us
Historical climate averages summarise patterns across a stated reference period. They can help readers recognise broad contrasts such as north versus south, west versus east, high elevation versus lower land, and inland versus more ocean-influenced settings.
The reference periods must remain explicit. The national maps on the cited source page are labelled 1981–2010, while its linked location graphs are labelled 1971–2000. Data carrying those labels should not be described as belonging to another period.
These historical averages are not current observations. They also are not a weather forecast. A map representing 1981–2010 summarises that historical reference period; it does not report what is happening today. In the same way, a location graph labelled 1971–2000 represents its stated period rather than present conditions.
Reference periods also matter when comparing material. Two displays with different periods are not labelled on the same basis, even if they discuss related aspects of climate. Readers should check the period, geographic scale and type of measure before drawing a comparison.
Regional averages are strongest as context. They show recurring broad patterns and make major geographic contrasts visible. Their limitation is that a regional category can contain substantial variation. An island-wide, coast-wide or compass-point description cannot stand in for a specific place, elevation or current observation.
Used carefully, the overview presents a coherent picture: broad warming towards the far north and cooling towards the far south, alpine conditions at elevation, mountain-driven west–east contrasts, different degrees of ocean influence, and rainfall seasons that vary by region. Used too broadly, the same information can hide the local differences that its multiple regional groups are designed to acknowledge.
Sources
Source checked for New Zealand readers on 13 September 2026.
- Earth Sciences New Zealand / NIWA — Overview of New Zealand’s climate. National maps on the page are labelled 1981–2010; linked location graphs are labelled 1971–2000.